This activity is another venue to showcase the image processing skills we have acquired so far.The aim is to play music from a musical score sheet.
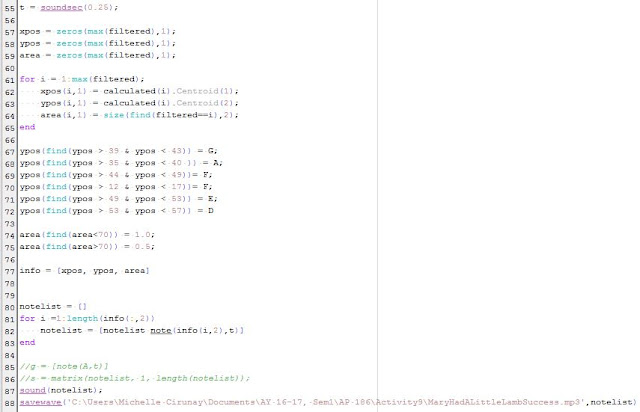
From the discussion in the manual, we learned that Scilab can sing using the following script. The frequency values assigned for each note can be found here: soundwave frequency.
Figure 1. Code to play a part of the song "Mary Had a Little Lamb"
For the application, I considered another nursery rhyme we are all familiar with-- the "London Bridge".Below is the musical score sheet of the song.
 |
| Figure 2. London Bridge |
Since some parts in the sheet are unimportant to accomplish our aim, we do some preliminary steps to remove them i.e removal of texts such as the title, conversion to black and white, the time signature and the cleft. We do this by using a Closing operator on the black and white image with a horizontal line as the structuring element,
 |
| Figure 3. Result after using a closing operator and a horizontal structuring element |
Notice, that we were not able to remove the staff or the five lines where the notes lie. This means that we need to yet apply another morphological operation. This time we use the Opening operator with a circle (r = 1.5) to remove the lines and the stems of the notes. And what I got is shown below.
 |
| Figure 4. Staff and stems removed |
Now what we want is to get rid of the large blobs that are the chords which are actually notes that are simultaneously played. To do this, I filtered the blobs using the function FilterBySize() which removes blobs whose areas do not fall within the specified range.
Because the London Bridge is a song introduced to children at a very early stage in learning, it is expected to have a repetitive pattern for easy retention. Notice that the rows have similar notes only differing in the 4th and 8th measure. For convenience, I only considered the upper row.
| Figure 5. The upper row of notes containing the 1st-4th measures |
Now we have the image that we want to read. This is actually my first time to read a musical score. I did not really like my music classes back in elementary and high school. So this activity is already a challenge from the very beginning. But from what I understood, the most critical is to determine the position of the note on the staff. For beginners like me, I recommend checking out this website for some basic explanation: How to Read Sheet Music.
Remember the code that can make Scilab sing? Well, it actually contains majority of what we need to accomplish in this activity.The critical part is to determine the vertical position of the notes. To do this, we again label the blobs and find the coordinates of its centroid using the Centroid function in the IPD library and then we assign the sound wave frequency value to each note.
Below is a snippet of the code which determines the centroid coordinates, area of the blobs which takes care of the note count other than that of a quarter note which is the simplest case i.e. whole note which will come in handy later; and ends in saving the music produced.
 |
| Figure 6. Code which determines the y-position of the notes and the soundwave frequency values |
To listen to the final product of all these processes, see "London Bridge" by Scilab.
Right now, I am trying out other songs with more complicated elements. Just to get a feeling of accomplishment, I put all of these here and the result of my said exploration are to follow. :)
This is the activity where I learned the most because I had to learn how to read a musical sheet for me to start. So I felt that I was really starting from scratch. Huuu sweetest feeling of success! <3 And for that I give myself a 10. :D
Acknowledgments:
In the final part of this activity, I was stuck because what I got was a continuous stream of sound and the London Bridge tune is hardly recovered. I would like to thank Roland Romero for helping me solve the problem by teaching me a way to concatenate to a list appropriate to my note function and eventually produced the desired tune! :)
References:
[1] M. Soriano, "Playing Notes by Image Processing", AP 186 class manual. (2016)
[2] "Physics of Music-Notes" retrieved from http://www.phy.mtu.edu/~suits/notefreqs.html on 4 November 2016
